Additional Greenhouse Gas Accounting
Indirect emissions result from campus activities that influence greenhouse gas emissions elsewhere. These are called "scope 3" greenhouse gas emissions. With the exception of daily commuting by employees and students, and university-funded air travel, Cornell assesses and tracks these additional emissions separately from the main Cornell GHG baseline inventory used to measure progress towards carbon neutrality by 2035.
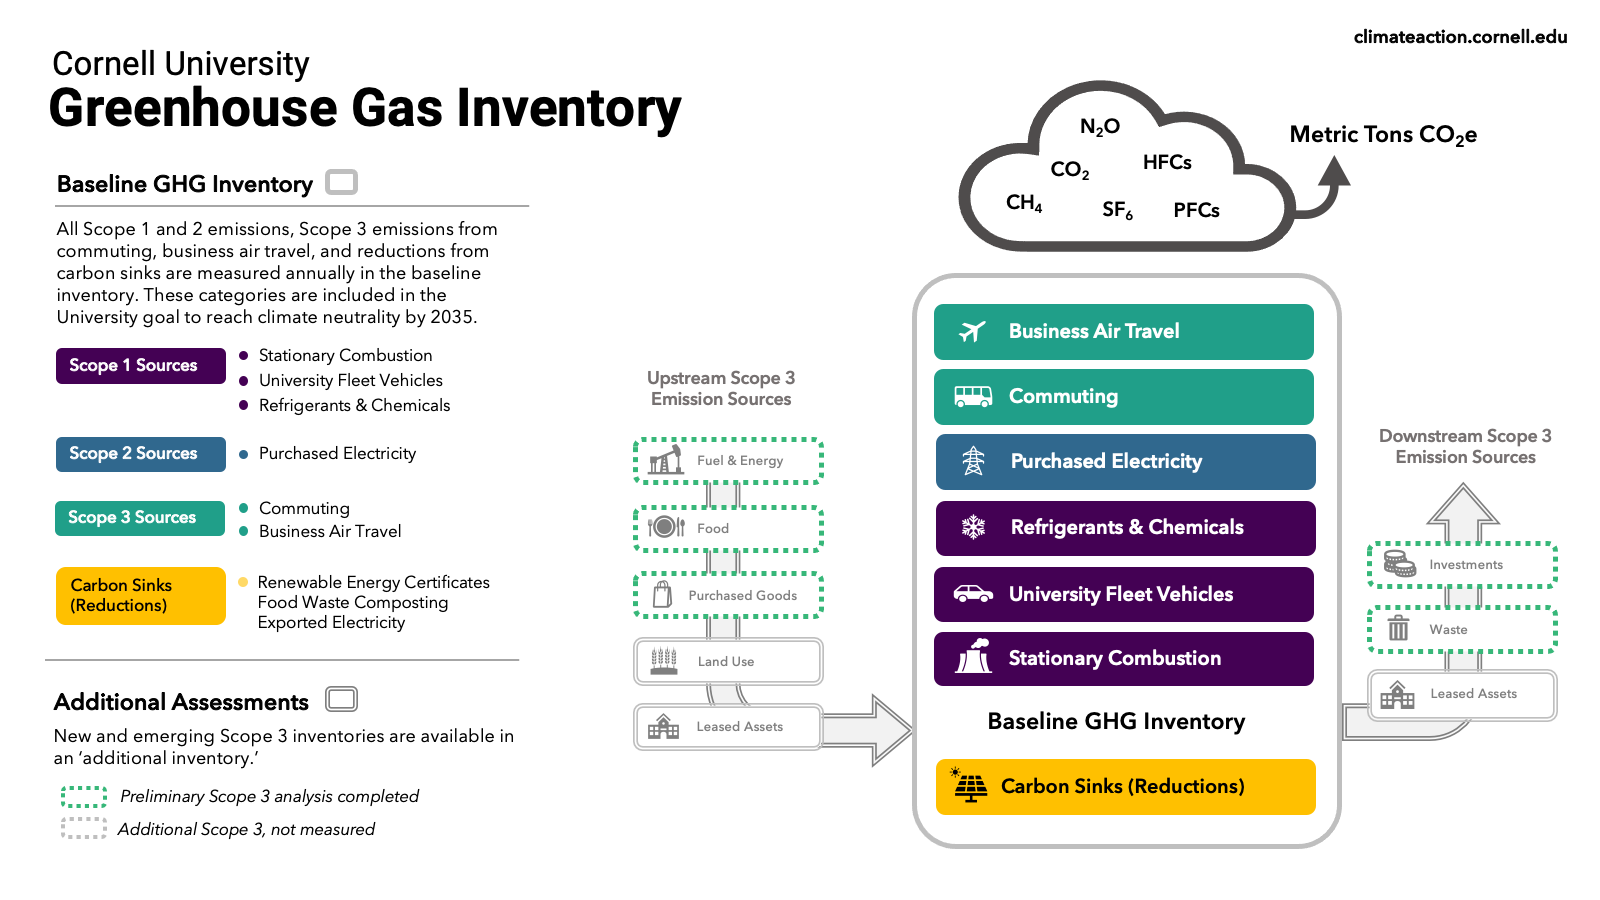
What is "Additional Accounting"?
The additional GHG inventory allows members of the campus community to contribute to a wider view of Cornell's organizational climate impact, without changing the original "goalposts" of the public carbon commitment. These additional areas of accounting also allow faculty and students to contribute to emerging greenhouse gas accounting science using Cornell facilities as a living laboratory to inform operational best practices and test solutions to scale for greater impact. Some additional inventories were completed once, others may be updated annually. Additional inventories are the responsibility of the interested party to assess and keep up to date.
Additional Inventory Assessments Available
Waste
Inventory first performed in FY2020 using the SIMAP Calculator by the Campus Sustainability Office.
This accounting area measures the carbon footprint from Cornell's disposal of landfill waste and wastewater.
Cornell's landfill waste is processed at a site with methane (CH4) recovery and electric generation, so the carbon impact of institutional waste is lower than if the waste went to a "traditional" landfill. This area can be reduced by producing less landfill waste on campus, and increasing recycling & composting. Some wastewater is sent to a local anaerobic digester, which also reclaims wastewater and ensures it is used for energy production.
This preliminary assessment suggests waste emissions are de minimus, meaning they comprise less than 1% of Cornell's total GHG footprint.
Greenhouse Gas Emissions from Solid Waste & Wastewater
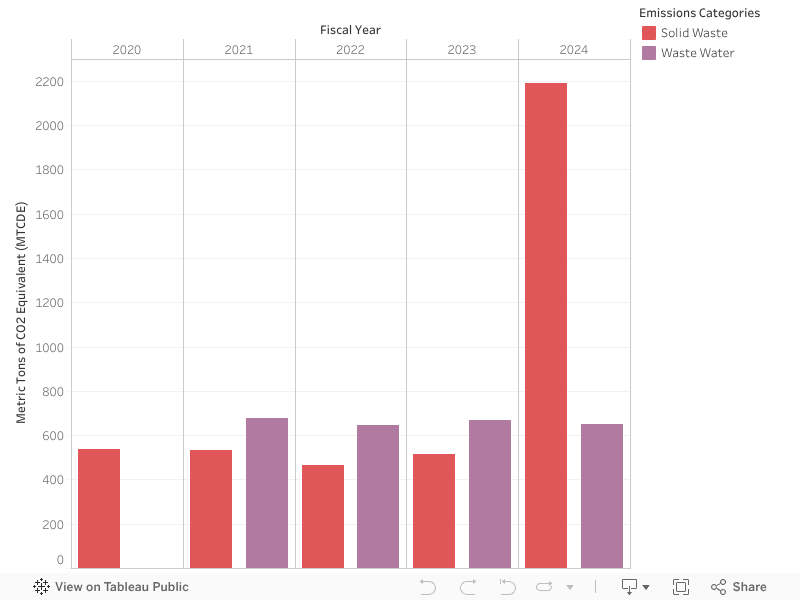
A substantial increase of reported emissions from waste handling in FY2024 is because of a switch to a more accurate calculation methodology. New source for emissions factors for waste is EPA Emission Factors Hub data released in 2024. The actual increase in handled waste was 3% by weight from FY2023 to FY2024.
Purchased Goods
This accounting area measures the greenhouse gas impact of Cornell's purchased goods across a wide variety of categories such as medical equipment, furniture, food, electronics, laboratory supplies, and building construction materials. Cornell's inventory was first performed in FY2019 using a methodology developed by Professor Natalie Mahowald, Earth and Atmospheric Sciences, the Campus Sustainability Office, and a student research team in partnership with Cornell Atkinson Center for Sustainability and The Sustainability Consortium. A second evaluation was published in the Journal of Cleaner Production in August 2022 as part of the paper COVID-19 impact on an academic Institution's greenhouse gas inventory: The case of Cornell University.
FY2019 Assessment
Dr. Natalie Mahowald, professor in Earth and Atmospheric Sciences and lead scientist for The Intergovernmental Panel on Climate Change (IPCC) and Campus Sustainability Director Sarah Carson (Zemanick) led a team of students EAS4900 during Spring 2019 to create the first comprehensive Scope 3 inventory of Cornell's purchased goods, using data available from procurement services at the University.
This preliminary assessment made initial attempt to clean and classify procurement data into logical groupings by which carbon emissions impacts could be measured. The course produced a supporting documents detailing their methodology, data classification, and results.
As of 2021, Professor Mahowald and University partners are working to use this preliminary assessment to develop a rigorous methodology that could be used by higher education partners across North America, in partnership with the UNH SIMAP team.
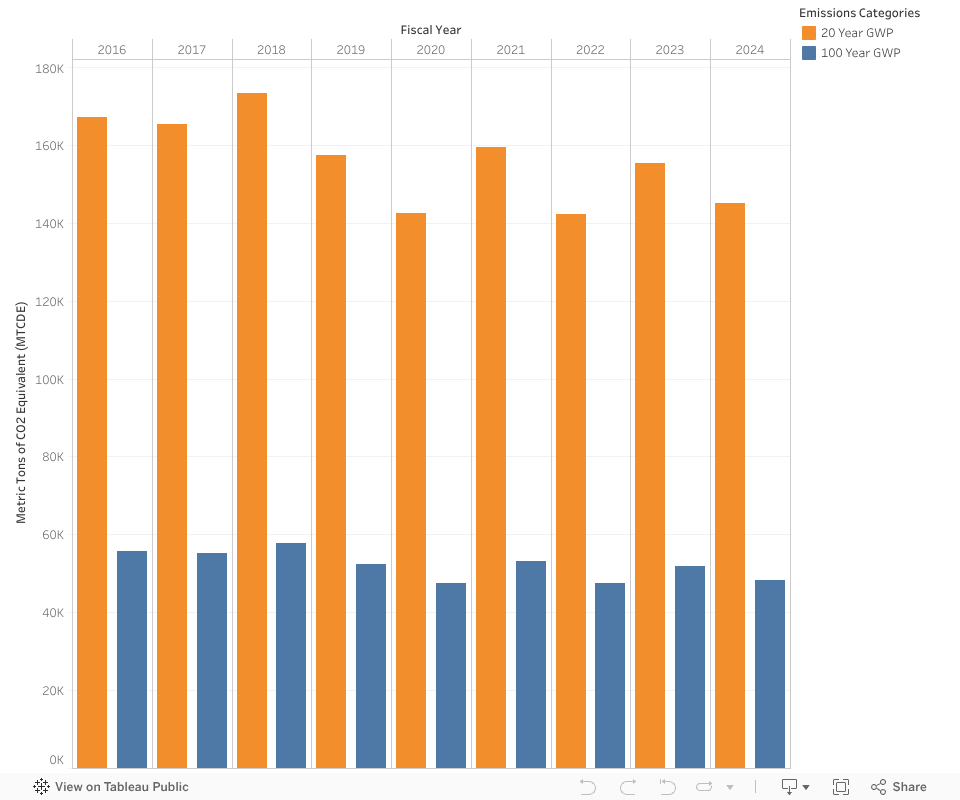
Fuel & Energy Related Activities
This accounting area includes methane emissions from extraction and delivery of the gas burned at the campus Central Energy Plant. The IPCC Special Report on 1.5C (SR 1.5) states that the primary driver of climate change is cumulative anthropogenic carbon dioxide (CO2) emissions. This results from both the huge scale of the emissions due to human activity and because 20-35% of anthropogenic CO2 emissions stay in the atmosphere for thousands of years, and thus accumulates. Climate forcers like methane are much more potent on a per-molecule basis (120 fold), and therefore contribute significantly to near-term temperature forcing, but do not accumulate in the atmosphere like CO2. Nonetheless, the IPCC AR5 report concludes that 25% of the current contribution to human-caused global warming is due to methane emissions. Further, many peer-reviewed papers published since 2012 show that reaching the UN COP21 target of keeping the planet well below 2oC is most easily accomplished by reducing both carbon dioxide and methane emissions. The IPCC AR6 report reinforces the need for parallel and complementary strategies to slow warming in the near term, avoid overshoot, and limit warming in the long term.
Meaningfully accounting for methane is complicated. The Global Warming Potential (GWP) metric was created to compare the impacts of different gases. GWP relates the warming potential of a given molecule (e.g., methane) to that of CO2. Because methane oxidizes to CO2 in the atmosphere, its residence time is less than that of CO2 and its GWP varies with time. The IPCC defines three standard values, GWP20 (based on a 20-year average following a pulse emission of methane), GWP100 (based on a 100-year average) and GWP500 (based on a 500-year average). All of these are relevant for analyzing the impact of upstream methane leakage on climate. The peak temperatures from climate change that we are trying to avoid are likely to occur close to 2100, but on the other hand methane emissions contribute significantly to the rate of global warming over the next 20 to 40 years. Hence the relative importance of the two molecules on climate is constantly changing.
Learn more about Global Warming Potential as a metric from the US EPA and the UNFCC IPCC:
- https://www.epa.gov/ghgemissions/understanding-global-warming-potentials
- Page 75 https://www.ipcc.ch/report/ar6/wg1/downloads/report/IPCC_AR6_WGI_TS.pdf
Cornell currently uses natural gas as a fuel source to heat and power the Ithaca campus as part of our district energy system's combined heat & power production at the Central Energy Plant (CEP). The modern CEP has several advantages over the retired coal-fired heating plant and separate procurement of electricity from the New York State grid. First, natural gas produces much less carbon dioxide than coal, per unit of energy produced. Second, the plant uses the waste heat from its electric turbines to heat the campus, increasing overall efficiency when the heat is also needed. These efficiencies have led to a substantial reduction in the carbon dioxide footprint of the campus. However, upstream leakage of methane from extraction and distribution of natural gas counteracts some of that benefit on the 20-30 year time scale. Cornell is therefore committed to eliminating its use on campus by 2035, and tracks both GWP20 and GWP100 for the upstream methane emissions associated with the natural gas consumed on campus.
For additional context, a mass balance analysis shows that for a constant source like the Cornell CEP, methane does not accumulate in the atmosphere like CO2 does, but rather approaches a steady state value over a 20-30 year time frame. Further, while precise data is not readily available to calculate the emissions of upstream methane associated with Cornell's use of coal for heat and grid electricity prior to converting to combined heat and power in 2010, we estimate that Cornell's upstream methane emissions haven't changed significantly given the efficiency gains from combined heat and power and the fuel mix of power generators on the NY grid at the time.
Greenhouse Gas Emissions from Fuel & Energy Related Activities
Forest Carbon Sinks
Information coming soon.