Additional Inventory
This section includes reporting and accounting of indirect emissions Scope 3 categories that are not a part of the baseline inventory. More information about the categories can be found in What are Scope 3 emissions? Some categories are accounted for each year, and some have only been accounted for once.
Purchased Goods and Services
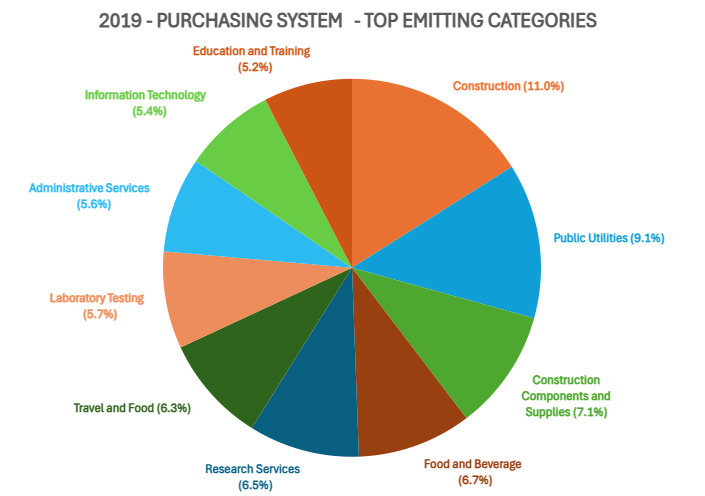
An inventory of purchased goods was first performed in FY2019 using a methodology developed by Professor Natalie Mahowald, Earth and Atmospheric Sciences, the Campus Sustainability Office, and a student research team in partnership with Cornell Atkinson Center for Sustainability and The Sustainability Consortium. A second evaluation was published in the Journal of Cleaner Production in August 2022. The chart shows the composition of the 10 top emitting categories from Cornell’s Procurement System, according to a study by Lu Sun et al., 2022 - COVID-19 impact on an academic Institution's greenhouse gas inventory: The case of Cornell University.
The percentage stated on the chart for each category is percentage emissions of the total emissions from the purchasing system. An economic input-output life-cycle assessment (EIO-LCA) model was used to investigate the emissions using the procurement data. The total emissions from the procurement system were estimated at 295,207.7 metric tons CO2e.
If you need access to the full report or further information, please reach out to the Campus Sustainability Office.
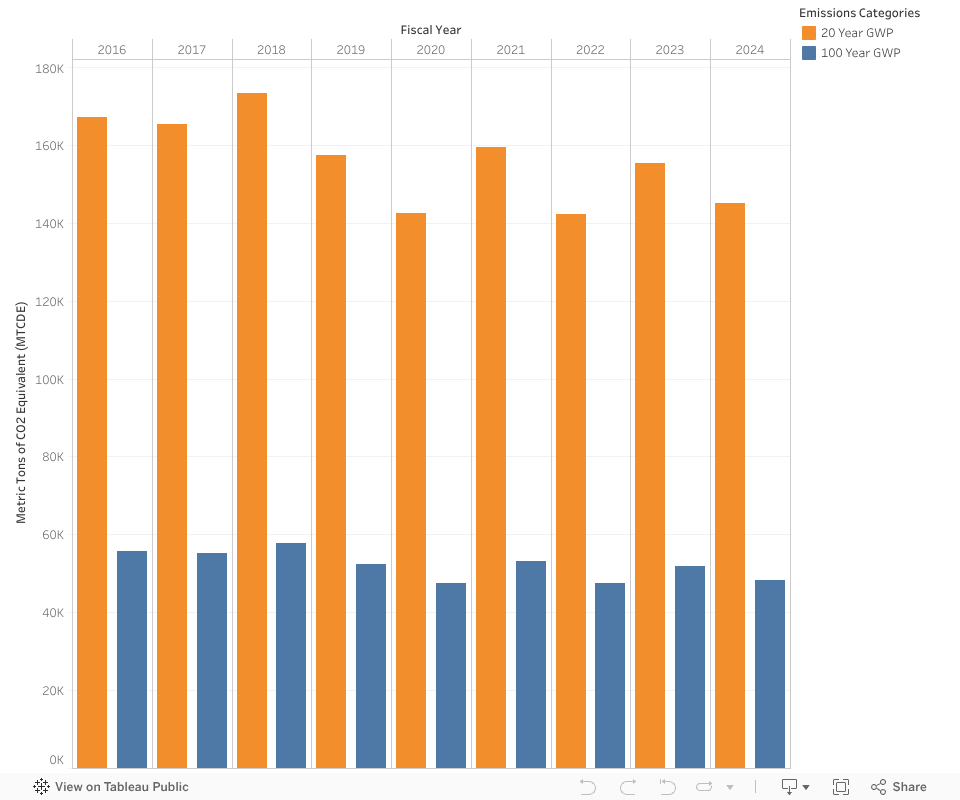
Upstream Fuel and Energy Related Activities (FERA)
The upstream FERA category covers upstream methane emissions related to produced and transported natural gas to Cornell’s combined heat and power plant (CEP).
This accounting area includes methane emissions from extraction and delivery of the gas burned at the campus Central Energy Plant. The IPCC Special Report on 1.5C (SR 1.5) states that the primary driver of climate change is cumulative anthropogenic carbon dioxide (CO2) emissions. This results from both the huge scale of the emissions due to human activity and because 20-35% of anthropogenic CO2 emissions stay in the atmosphere for thousands of years, and thus accumulates. Climate forcers like methane are much more potent on a per-molecule basis (120 fold), and therefore contribute significantly to near-term temperature forcing, but do not accumulate in the atmosphere like CO2. Nonetheless, the IPCC AR5 report concludes that 25% of the current contribution to human-caused global warming is due to methane emissions. Further, many peer-reviewed papers published since 2012 show that reaching the UN COP21 target of keeping the planet well below 2oC is most easily accomplished by reducing both carbon dioxide and methane emissions. The IPCC AR6 report reinforces the need for parallel and complementary strategies to slow warming in the near term, avoid overshoot, and limit warming in the long term.
Meaningfully accounting for methane is complicated. The Global Warming Potential (GWP) metric was created to compare the impacts of different gases. GWP relates the warming potential of a given molecule (e.g., methane) to that of CO2. Because methane oxidizes to CO2 in the atmosphere, its residence time is less than that of CO2 and its GWP varies with time. The IPCC defines three standard values, GWP20 (based on a 20-year average following a pulse emission of methane), GWP100 (based on a 100-year average) and GWP500 (based on a 500-year average). All of these are relevant for analyzing the impact of upstream methane leakage on climate. The peak temperatures from climate change that we are trying to avoid are likely to occur close to 2100, but on the other hand methane emissions contribute significantly to the rate of global warming over the next 20 to 40 years. Hence the relative importance of the two molecules on climate is constantly changing.
Learn more about Global Warming Potential as a metric from the US EPA and the UNFCC IPCC:
- https://www.epa.gov/ghgemissions/understanding-global-warming-potentials
- https://unfccc.int/process-and-meetings/transparency-and-reporting/methods-for-climate-change-transparency/common-metrics
- Page 75 https://www.ipcc.ch/report/ar6/wg1/downloads/report/IPCC_AR6_WGI_TS.pdf
Cornell currently uses natural gas as a fuel source to heat and power the Ithaca campus as part of our district energy system's combined heat & power production at the Central Energy Plant (CEP). The modern CEP has several advantages over the retired coal-fired heating plant and separate procurement of electricity from the New York State grid. First, natural gas produces much less carbon dioxide than coal, per unit of energy produced. Second, the plant uses the waste heat from its electric turbines to heat the campus, increasing overall efficiency when the heat is also needed. These efficiencies have led to a substantial reduction in the carbon dioxide footprint of the campus. However, upstream leakage of methane from extraction and distribution of natural gas counteracts some of that benefit on the 20-30 year time scale. Cornell is therefore committed to eliminating its use on campus, and tracks both GWP20 and GWP100 for the upstream methane emissions associated with the natural gas consumed on campus.
For additional context, a mass balance analysis shows that for a constant source like the Cornell CEP, methane does not accumulate in the atmosphere like CO2 does, but rather approaches a steady state value over a 20-30 year time frame. Further, while precise data is not readily available to calculate the emissions of upstream methane associated with Cornell's use of coal for heat and grid electricity prior to converting to combined heat and power in 2010, we estimate that Cornell's upstream methane emissions haven't changed significantly given the efficiency gains from combined heat and power and the fuel mix of power generators on the NY grid at the time.
Waste and Wastewater Treatment Activities
Emissions related to waste and wastewater treatment1.
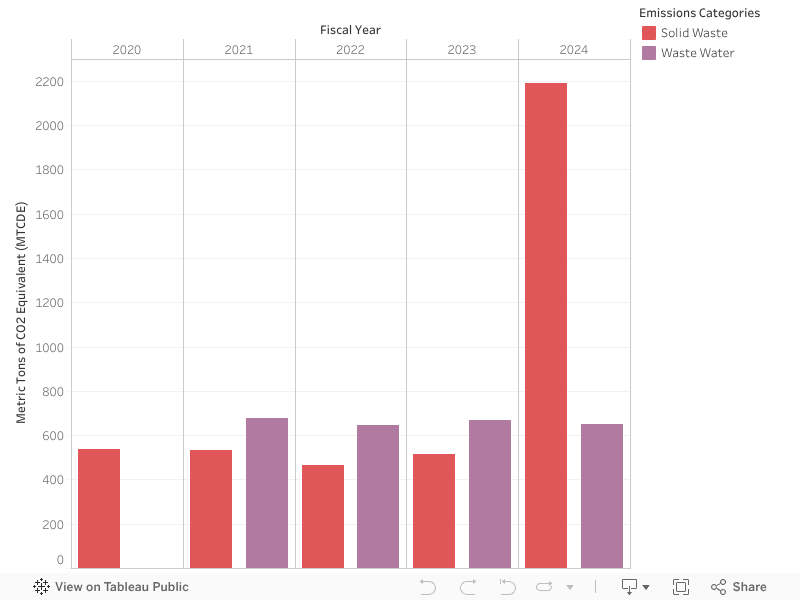
1A substantial increase of emissions from waste handling in FY2024 is due to a change to a more reliable emissions factor. The actual increase in quantity handled waste was 3 weight-% from FY2023 to FY2024. Learn more about Notable Changes in Reported Greenhouse Gas Emissions